Recent industry study by A Word About Wind shows that validating performance of wind farms is the industry’s biggest priority
To help address this focus, on the 16th July 2020, UL, a leading global safety science company, hosted a live event with Lidar OEM ZX Lidars and presented case studies performed around the world that highlight what can be achieved in the area of plant optimisation with nacelle-based wind Lidars.
The webinar is available here:
The webinar discussion generated a significant Q&A discussion and only a few topics could be covered so a full response can be found below! Responses have been provided by UL and ZX Lidars and are identified accordingly.
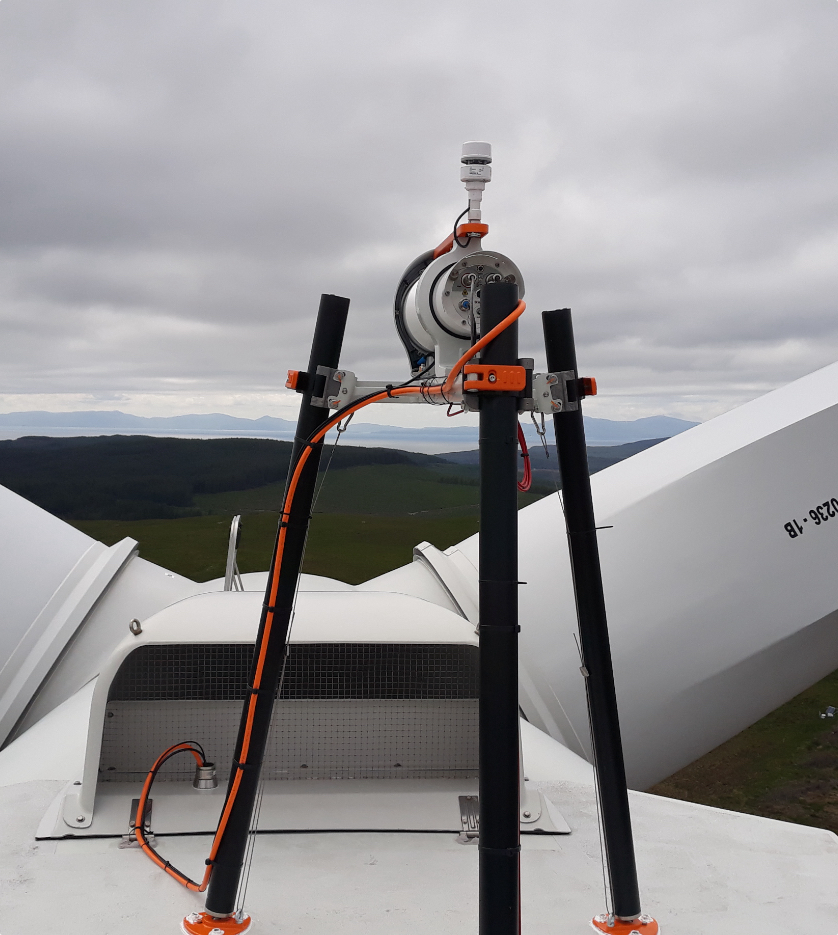
How do you ensure the alignment between the lidar and the nacelle?
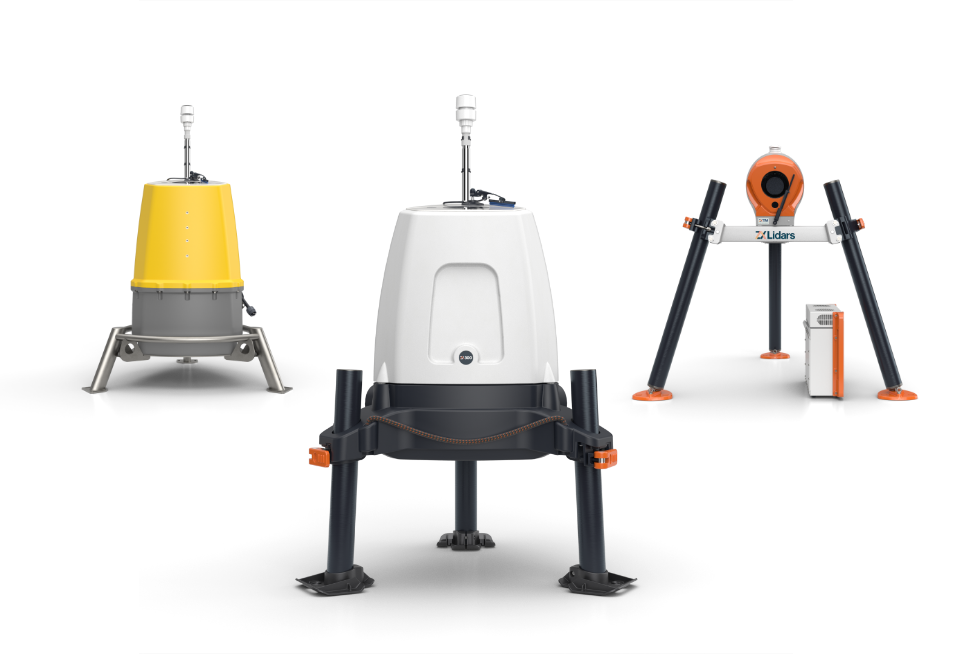
There are two techniques used. The first common approach is based on using a visible laser line projector at deployment. This is integrated in the ZX TM Lidar Optical Head (LOH) and its operation is part of the standard deployment procedure. You can turn this laser on/off via a Smartphone using our web interface. The projected laser line is used to ensure that the lidar optical axis is parallel to the rotor axis by measuring the relative alignment of the laser with the marked or measured turbine axis. The LOH position is adjusted until the two are parallel. If done properly, this aligns the two axes to within ±1°

The second more novel technique (patent pending) has higher precision, and uses the campaign’s ZX TM data. The lidar reflections from the rotating blades themselves are used to measure the relative alignment of the rotor and lidar axes. Data can be analysed from any time during the campaign, but a few hours of collected lidar data are required, from when the turbine is running normally. This approach allows the deployment alignment accuracy to be checked. If necessary the measured alignment offset can be used to correct the WYM (wind yaw misalignment) measured by the lidar. An accuracy of ±0.1° can be achieved.
Do you measure at one distance at a time (one distance every second)?
The number of measurement ranges and the time spent at each range can be adjusted to ensure you are focussing all of the power of the laser at the measurement range of interest rather than sharing laser power and sacrificing availability across multiple / unused ranges. ZX TM takes just ~ 100 ms to move between ranges so a number of ranges can be measured almost simultaneously. The Lidar automatically configures the measurement set up depending on which Application you have selected (e.g. Power Curves, Wind Yaw Misalignment etc.) but everything can be adjusted to suit your exact requirements for the campaign by the user.
Lidar measurement total uncertainty
The process for assessing the total uncertainty in the wind speed measured by a nacelle-mounted lidar, such as the ZXTM, forms part of the latest draft of international standard: IEC 61400-50-3 CD01_02 (May 2020). It Is based on work performed by DTU and reported in the Journal of Remote Sensing [Borraccino et al, Remote Sens, 2016, 8, 907]. In that paper, a typical standard uncertainty in the line-of-sight wind speed is given as 1% at 10 m/s. In non-complex terrain, the uncertainty in the horizontal wind speed reconstructed from a pair of line-of-sight measurements used by ZX TM to calculate wind speed at any given height above ground level is also shown to be 1% at 10 m/s as any uncertainties due to other parameters in the wind-field-reconstruction algorithm are shown to be negligible. The uncertainty contribution due to varying environmental conditions is expected to be small.
What is the accuracy of data?
Wind speed: ±0.1 m/s
Wind direction: ±0.5°
Any comments about the effect of the rotor blades to the LIDAR data?
The rotor blades pass in front of the laser beam. ZX TM samples at every 20 ms and obtains ~ 50 points per circular scan so any data received from the passing blades that is automatically removed has only no traceable impact on data availability. Data availability is independent of rotor rotation rate during normal turbine operation. The lidar can easily distinguish between returns from wind aerosols and the blades.
What exactly does “flow complexity measures” contain?
There are various flow complexity measures within ZX TM, unique to a scanning 50 measurement point Lidar. A primary one allows wakes and other complex inflow situations to be detected and quantified allowing for further analysis of impact to AEP for example.
The ability supports faster more accurate power curve measurements that rely less on sector analysis as the Lidar automatically filters out unsuitable data. This allows ZX TM to be used in complex terrain onshore and in waked conditions onshore and offshore.
How would the data accuracy be effected in monsoon conditions?
Measurement accuracy is independent of wind speed. ZX Lidars are already used widely in extreme wind measurement conditions for example in the assessment of hurricanes passing through offshore platforms.
Can you give a bit of details on the TI measurement? How do you overcome the space averaging ( along the line of sight and crosswise) which is an intrinsic drawback of the measurement system?
As the wind industry is still largely anchored on traditional cup based reference measurements, the main TI measurement algorithm in the ZX TM is based on the spectral average of the Doppler profile. Independent analysis (see Pena et al, Wind Energ. Sci., 2, 133–152, 2017) shows that this spectrally averaged turbulence intensity (SATI), also known as “Ensemble-average Doppler radial velocity spectrum” TI produces range independent TI measures which are comparable to more conventional cup TI.
Is there a possibility to correct pitch errors of your beams due to moving of nacelle back and forth, though beams were aligned in calm conditions?
The ZX TM lidars monitor their inclination and roll in real time, and this information is automatically accounted for in the system’s processing chain. In this way, nacelle motion is compensated for, and hub height wind speed measurements (for example) are unaffected by turbine motion. Incidentally, the ZX TM circular scan also allows for relaxed installation tolerances – there is no need, for example, to set the inclination of the lidar to a precise value at installation.
Is vertical profiler more accurate as compared to nacelle mounted lidar?
All ZX Lidars – vertical profiling or nacelle mounted – are based on the same core technology and subject to an approved Factory Acceptance Test, validated on more than 700 individual IEC compliant met mast Performance Verifications. Both vertical and horizontally scanning systems deliver data accuracy that is both bankable within Energy Yield Assessments or accepted within Turbine Supply Agreements for the purpose of Power Performance Measurements, respectively.
The application should define the appropriate use of vertical or nacelle-mounted Lidar. For power performance testing, nacelle mounted lidars produce higher precision measurements than a ground lidar (partly because they always measure the wind that the turbine experiences). They also have several other advantages for that application. ZX ground lidars measure the inflow angle (vertical wind components), so if that is important (e.g. for flow characterisation on a complex site), ground lidars can be useful instead.
Is there something like maintenance needed for the lidar during the measurement campaign? or just mounting and dismantling? (and analysing the data of course).
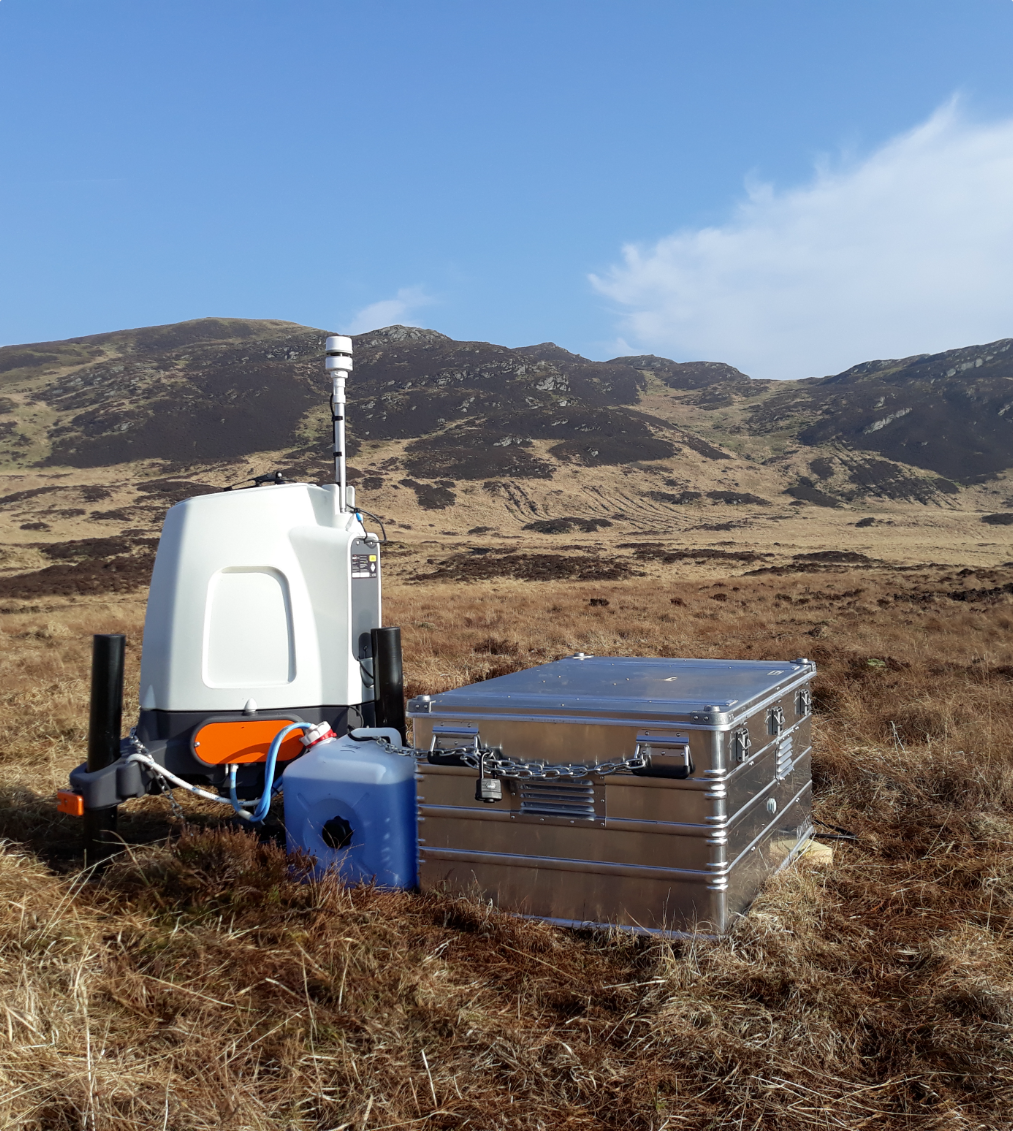
All ZX Lidars require just 1 week of planned maintenance during a 5-year operating period.
What are your thoughts on doing non-contractual power curve test with nacelle-Lidar in complex terrain? Either correcting with CFD or induction zone corrections?
ZX TM is ideal for use within complex flow environments either caused by terrain or turbine wakes. The systems unique 50 point scan provides the ability to detect complex flow and filter it so that only suitable data in included in your analysis. We can share examples of clean power curves taken in complex terrain. Contact ZX Lidars for more information.
Further, techniques such as wind field reconstruction from 1D to 2.5D using induction zone models are also proving to be an excellent method of removing the effects of complex terrain. Again, there is a growing body of evidence that can be shared here. This methodology could be particularly useful offshore as turbines continue to increase in size and measurements at 600m, 700m and beyond are still being effected by the wind wall effect so a closer range measurement would be beneficial to remove that and model out instead.
Projects are already being undertaken today in collaboration with WTG OEMs that have achieved power curves in complex terrain.
Nacelle lidars can measure wind ahead to ~550m which is equivalent to ~2-3 rotor D for some modern big offshore turbines – this is within the turbine induction zone which has been the topic of various industry research in to blockage effects … how is this being overcome by the technology / user applications?
We can work with you use induction models to synthesise any collected Lidar data. We have had good success using the Medici 1-D induction zone model (we have a poster in this year’s Torque conference with some results). Interestingly, Sowento (www.sowento.com) have developed a commercial tool to work with induction zone measurements too, known as Pewit. This builds upon some of the successful work in the DTU led UniTTe programme. While ZX TM can measure Power Performance Measurements at contractually permitted ranges for all new large offshore turbines, this novel approach does overcome non-lidar related issues that 2-3 D measurements may pose challenging for the industry whatever the measurement device.
What type of correlation are you finding between conventional anemometry wind measurement values and REWS. Is REWS the correct assessment of WTG performance versus contracted commercial power curve? Can REWS be lower than Anemometer measured wind speeds on low wind speed sites <7m/s?
Conventional metmast anemometry has trouble measuring high precision REWS, largely due to the sparse instrumentation on most masts. However, we have found excellent correlation between REWS measured by ZX TM and ground lidars
Whilst most TSA (Turbine Supply Agreements) use Hub Height contractual power curves there is acknowledgement that the uncertainties of HH power curves increase with rotor size, especially on some sites and REWS across up to 11 slices can provide beneficial information for all parties.
There are certainly situations where a REWS wind speed can be lower than a HH one. For example, with a typical power law vertical shear wind profile, REWS wind speed will be lower than HH.
Could you recommend any prior analysis with SCADA data to identify Yaw misalignment ?
Prior yaw misalignment analysis based on SCADA data only may be useful to identify any suspected high yaw deviations prior to a lidar campaign. We insist on the word “suspect” because accurately quantifying the misalignment within reasonable uncertainty is not possible from SCADA data only. For example, in a wind farm composed of 20 wind turbines, if SCADA analysis suggests 5 wind turbines have a very high misalignment, it may be an indication that a lidar measurement is warranted to measure the yaw misalignment. Moreover, care is needed with the Scada data because some offset or yaw north offset for instance can impact the results.
How long does it take to complete a power performance measurements?
A power performance test takes approximately 3 months, and can be extended further depending on the wind conditions, width of free measurement sector, and additional required filters (on shear, veer, TI… etc).
Using ZX TMs unique flow complexity filter can help reduce the measurement time by automatically removing unsuitable data. Turning on the automatic filter places less reliance on user-determined clean sectors that could otherwise potentially remove good data that could be used.
Should we expect lower uncertainty with nacelle lidar comparing to power curve test with mast?
It is expected that the scatter will be reduced by using a nacelle lidar as the lidar will always measure the wind in front of the wind turbine. The overall measurement uncertainty for nacelle lidar will dependent on the lidar device. The overall uncertainty of a nacelle mounted lidar should be quantified during the lidar calibration prior to the measurement.
In practice, how do we know that Yaw is already misaligned?
A yaw misalignment is one of the first elements to investigate when an underperformance is observed or suspected. In practice it is difficult to accurately quantify a yaw misalignment prior to a dedicated investigation, likely with a nacelle-lidar. A first assessment based on SCADA data may be done, with the understanding that the results will likely have high uncertainty as per the above comments.
Do we often experience turbine over-performance measured by a nacelle Lidar?
We more frequently observe power curves matching warranty power curves or an underperformance. In a few cases we observed overperformance but we think that this could be due to a conservative power curve.
However, we sometimes observe a different behaviour with wind speed, with for example a slight overperformance at low wind speeds, and the opposite near the knee of the power curves. In this case, in general the AEP will be very close to the warranty one.
On the case study of yaw misalignment, why does the biggest difference in energy occur just at the knee of the power curve following correction?
In general, the Region 2 power curves before correction was inferior, but there is a particularly large difference at the knee. It could be that this very large wind yaw misalignment was affecting the turbine anemometer calibration.
What is the inaccuracy level of nacelle mounted turbine anemometers typically?
For some cases, we have observed more than 5% of deviation in wind speed between the wind speed measured by the nacelle anemometer and the free wind speed @2.5D measured by the nacelle-based lidar. A deviation of 2 or 3% is quite usual in the analysis we have done. Other point to have in mind is that the calibration of the anemometer is a “black box”, and it is very difficult to have access to it, therefore the reliability of this feature is very low and cannot be use to perform an accurate performance test.
On the graph showing the wind profile across the RD with the Vestas WTG, have you seen this profile on other projects or is it kind of a one off?
It is actually extremely common, even on simple sites, to see significant deviations from power law shear profiles e.g. at certain times of day. The effects of which are completely missed by a hub height met mast. And, while some nacelle based Lidars use the same power law shear profiles to extrapolate between pairs of measurements that could suffer the same effect, ZX TM provides actual measurements across the full swept rotor area capturing these effects as demonstrated on the Vestas case study.
When measuring yaw misalignment, do you measure the distribution of misalignment of wind? It has been noticed that non uniform distribution on misaligned machines is non uniform – do you agree?
Yes, the variation of wind yaw misalignment (WYM) with wind speed is in the lidar data. It can be quite significant. Optimum correction should use that information, along with the wind statistics at the turbine location, to choose the WYM correction to maximise AEP gain.
Here is a typical variation of WYM with windspeed, measured by a ZX TM lidar. Red is 3-6 m/s, orange is 6-9 m/s etc.

On a Wind Farm, what is the percentage of wind turbines that present considerable yaw misalignment? Have you done studies about it?
Based on 100MW we have analysed the mean value of misalignment is near 4°. The maximum of misalignment is >8° and the minimum is <0.5°. Usually we consider a high misalignment if the value is >5°. On our database, we have observed that 42% of the fleet have a misalignment > 5°. The other interesting point is that we may see a correlation between the turbine type and the value of the misalignment.
How do you do a power performance test when a site calibration is required?
Certain WTG OEMs will, within limits, offer the possibility for a site calibration using a ZX TM. The specific turbine will be stopped and a site calibration will take place. Following the site calibration, the power curve measurements will take place.
What is the average increase in AEP% from yaw misalignment based on the historical studies.
On the analysis we have done, the average increase in AEP% follows fairly well the empirical laws and is somewhere between the cos2 and the cos3 of the yaw misalignment. We believe that these laws can quantify in an accurate way the potential gain of the yaw correction. As a rule of thumb, 7° misalignment leads to 2% of AEP increase.
In a recent industry first white paper looking at Lidars deployed across a whole wind farm, a broad set of value adding benefits were identified with nacelle-based Lidar including yaw misalignment as discussed here but through to increasing Net Project Value by up to quite a staggering 10% when re-calculating the Post Construction Yield Analysis given the higher certainty measurements provided by the nacelle-based Lidars. This increase in value could be released at the point of project sale or refinancing and is a growing area of focus of both long-term asset owners and at the point of any financial transaction. Please ask for further details.
Is there any cost advantage using nacelle LIDAR vs ground-based LIDAR?
The monthly lidar costs are similar for ground-based or nacelle-mounted lidar. Nacelle-mounted lidar will require extra costs for installation, and close collaboration with the OEM. However the added benefit of nacelle-mounted lidar is the ability to always measure the incoming wind, which leads to shorter measurement campaigns. Ground-based lidar measurements for turbine performance assessments will be limited in direction sector, generally requiring longer measurement periods, potentially leading to higher costs in the end.
How do I access such a service?
For UL, our Asset Management and Power Performance Testing teams are ready to discuss your needs. Please contact Business Development Manager, Thibaut Labonde (Thibaut.Labonde@ul.com) for further details.
For ZX, our nacelle-based Lidar experts are ready to discuss your needs. Please contact Alex Woodward (alex@zxlidars.com) for further details
What are the costs for a measurement campaign? And the time period needed (depending on the site, wake etc. of course)?
Please get in touch with us to discuss your specific needs. Business Development Manager, Thibaut Labonde (Thibaut.Labonde@ul.com).
Would there be value in having a lidar on every turbine?… what benefits would that bring over the years?
Depending on the size of the wind farm, the benefit to have a lidar installed in different parts of the wind farm can bring you some information of the local wind conditions (wind speed, shear, TI, etc..) that can differ significantly from turbine location to turbine location, if the wind farm is large and the terrain is complex.
For example if the wind farm is large and in complex terrain, a nacelle mounted lidar campaign on a single turbine will not be representative of the wind conditions on the entire wind farm.
At the other hand, if the wind farm is small and in flat terrain, you may be able to extrapolate the results to the entire wind farm, but here again you have to be careful because for example if you analyse the NTF the extrapolation of one NTF to the other wind turbines is, in our opinion, not possible due to several reasons : calibration of the nacelle anemometer is not accessible, and probably not the same on each wind turbine, you have to get a proper historical of the maintenance of the wind sensors, etc..
In a recent industry first white paper looking at Lidars deployed across a whole wind farm, a broad set of value adding benefits were identified with nacelle-based Lidar including yaw misalignment as discussed here but through to increasing Net Project Value by up to quite a staggering 10% when re-calculating the Post Construction Yield Analysis given the higher certainty measurements provided by the nacelle-based Lidars. This increase in value could be released at the point of project sale or refinancing and is a growing area of focus of both long-term asset owners and at the point of any financial transaction. Please ask for further details.
Is such power curve testing accepted by WTG manufacturers and can be used in contracts?
Yes! They are negotiated by the wind farm owners with the OEM. Offshore, power curve warranty verifications have been undertaken by nacelle-based Lidars since 2010. Owners can push in this direction and already include this option by mentioning the draft standard IEC 61400-50-3 in their contracts. Onshore increasingly nacelle-based Lidars are accepted as they provide opportunities to measure in both simple and complex terrain using the techniques discussed here.
Often the commercial aspects of the Turbine Supply Agreement work outside of the IEC standards which follow afterwards.
Is it possible to confirm which OEM’s have included such in a TSA?
While we are often bound to confidentiality agreements we are happy to put you in touch with the relevant contacts within WTG OEMs. Please get in touch with details of the project and OEM.
Aside from its acceptance, what is/are the biggest disadvantage(s)/handicap(s) of using nacelle mounted Lidar for Power Performance Measurement?
A nacelle mounted lidar campaign can require the acceptance of the OEM if warranty conditions are to be observed as the installation implies a physical modification on the nacelle. Siting of the nacelle lidar will also take in to account the control strategy of the WT (disturbances on nacelle sensors, impact on yaw error detection etc.). The risk can be mitigated by discussing beforehand the optimal lidar mounting strategy with the lidar manufacturer, the engineering consultant and the OEM. To date, ZX TM has been installed on every wind turbine platform encountered – accepted by the OEM and without impact to the turbine control.
How is your experience of collaboration with manufacturers?
Excellent! Please get in touch with details of your own projects and OEM and we can provide relevant contacts.
How can this Lidar arrangement be useful when there is no WTG, i.e. in a greenfield project?
Onsite measurements with a ground-based lidar can add value to a pre-construction wind measurement campaign. For example ground-based lidar can be used as a stand-alone measurement with no mast on site for an energy yield assessment. In addition, if the planned turbine hub heights are much higher than the on-site mast, a ground-based lidar can be used concurrently with the mast to measure the shear profile above the mast top height and subsequently reduce the uncertainties linked to vertical extrapolation. Finally, if the planned project area covers a significant area, a ground-based lidar can used as a second measurement point in the project area, concurrently with a mast, to reduce the uncertainties linked to horizontal extrapolation.
Will the Lidar data alone can consider bankable? or still need to have a met mast?
A stand-alone lidar campaign with no mast on-site has been accepted since 2012 as a valid on-site wind measurement for an energy yield assessment! We are in our 8th year of bankable measurements.
And also when the terrain is hilly and there is no WTG deployed. How can Lidar be better than met mast?
For energy yield assessments in moderately complex terrain, in the current IEC standards, a met mast on site is still required. But the addition of a lidar in such a project may add value in measuring the shear above the mast height. In addition, a lidar measurement in another location in the project area, along with appropriate CFD modelling, can help measure local wind conditions that may differ from the met mast location because of the terrain.
Working ahead of IEC, wind assessments are already being undertaken to a bankable level with standalone Lidar in complex (through to extremely complex) terrain using either a traceable white box adjustment of the data to mimic met mast data (volume data > point data) from that location, or a pragmatic approach to assessing Lidar location and uncertainty can be adopted. Often the significant benefits of a ground-based Lidar (speed to deployment, planning conditions, mobility, measurement height, safety, quality of data) will further support the Lidar approach rather than a met mast.